
Mapping Karachi’s Emissions
An understanding where and when pollution peaks is crucial for designing effective mitigation strategies and public health advisories. This inventory analysis reveals important spatial and temporal patterns in Karachi’s urban emissions.
Where is the Pollution?
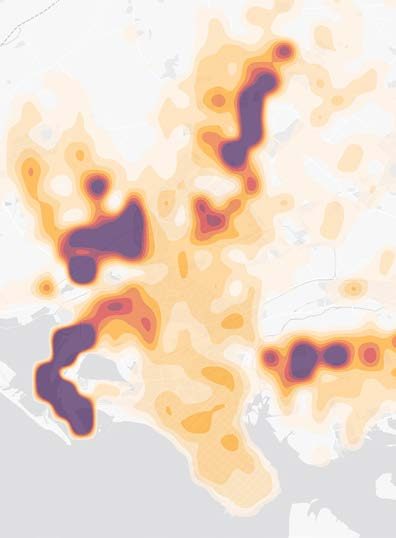
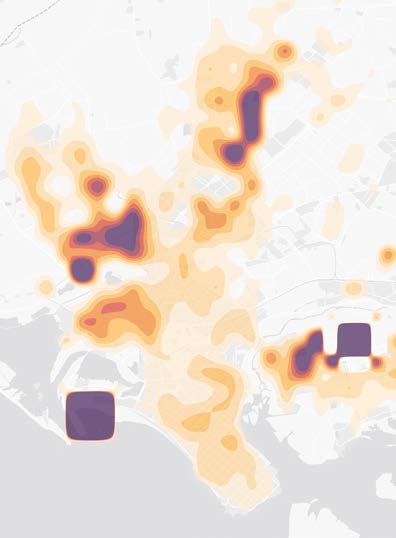
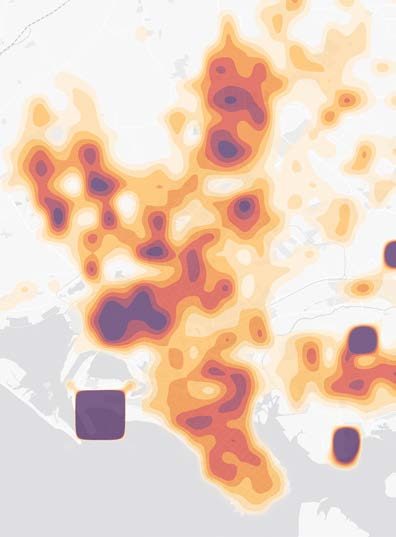
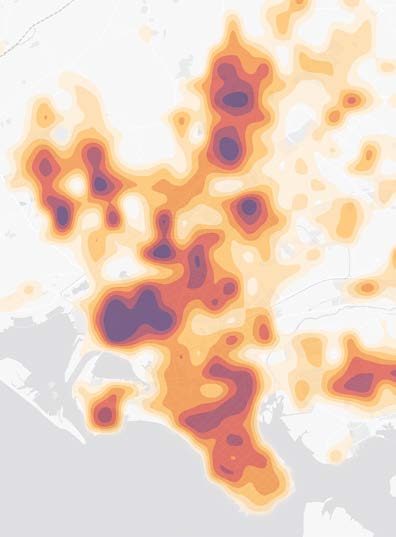
The spatial allocation of emissions reveals distinct patterns across Karachi, closely reflecting the city’s economic geography and land use.
Industrial zones: The highest PM2.5 emission densities are consistently observed in and around designated industrial zones, also identified as the largest polluting sector. These include prominent areas such as the Korangi Industrial Area, Landhi Industrial Area, and the Port Qasim industrial zone, particularly in the eastern and southeastern portions of the city.
Transportation corridors: Significant linear patterns of emissions, especially NOx and CO, follow major freight and commuter routes. These corridors connect port facilities with industrial areas and extend to national highways, with notable concentrations along arteries like the Lyari Expressway, Northern Bypass, and National Highway.
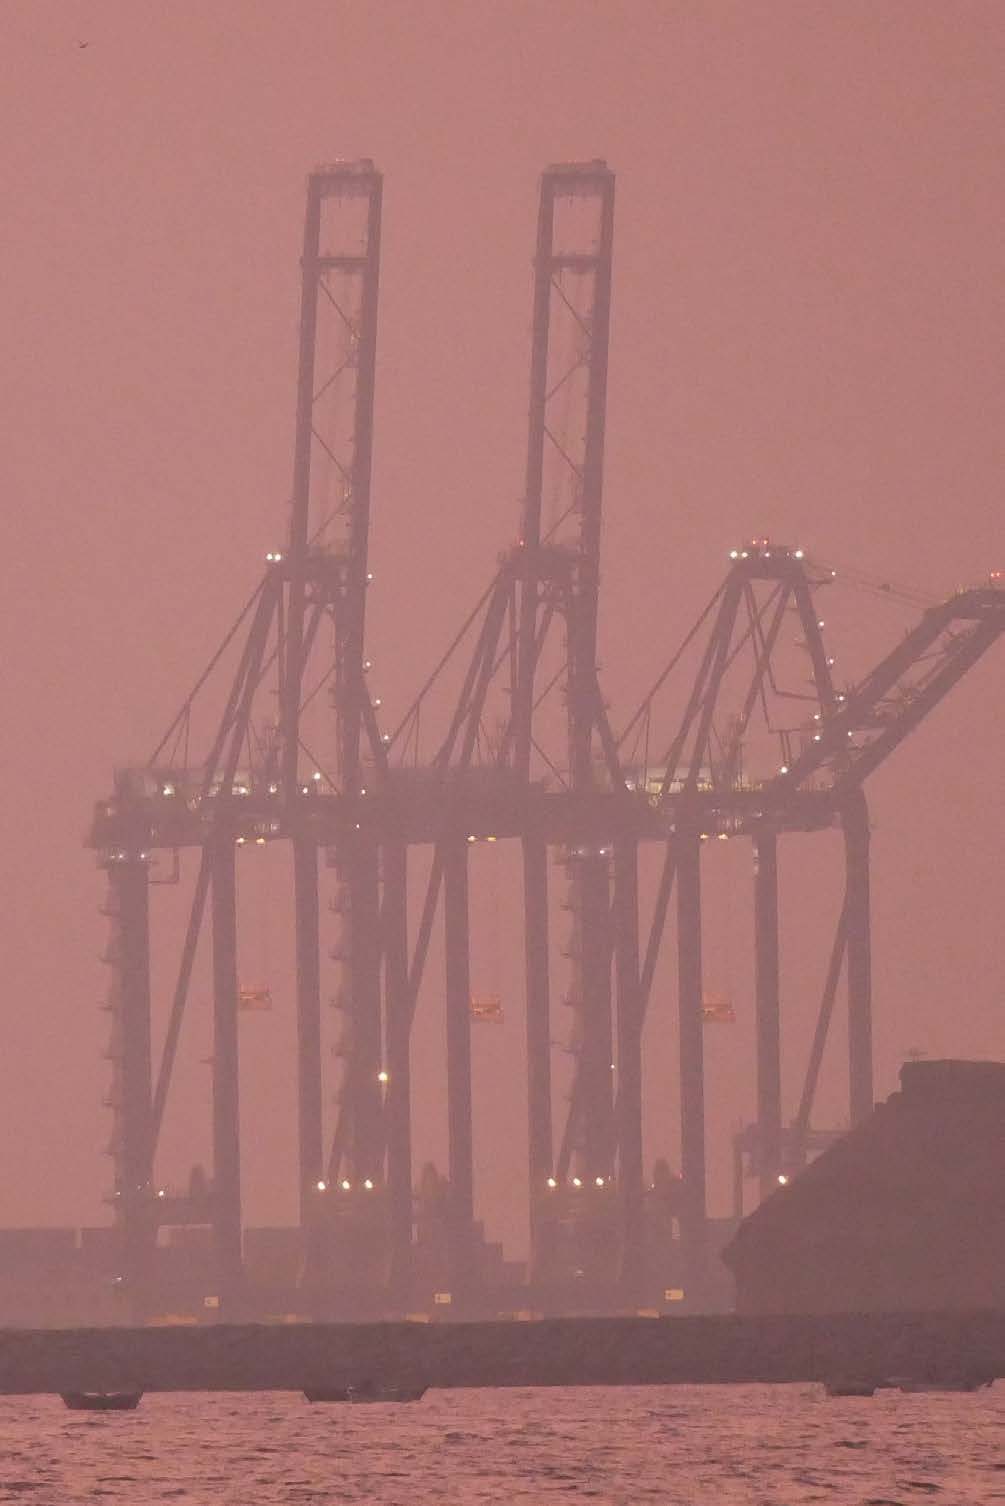
Port hotspots: Areas immediately surrounding both Karachi Port and Port Qasim exhibit elevated emission levels. This is due to the combined impact of emissions from docked and maneuvering ships, loading/unloading operations (e.g., cranes, vehicles), and the heavy road transport associated with port activities.
Power generation: Specific locations with high emission densities are identified around major power plants, particularly those situated in the eastern parts of the city.
These spatial patterns underscore the importance of targeted interventions in high-emission zones. The concentration of emission sources in specific districts provides opportunities for focused mitigation efforts but also raises significant environmental justice concerns for communities residing near these industrial and transportation corridors.
When is the Pollution Worst?
While this inventory primarily focuses on annual emissions, insights from general patterns and data from other urban centers in the region allow for an understanding of likely temporal variations.
Seasonal variations: Urban pollution levels in Pakistan, including coastal cities like Karachi, often exhibit seasonal fluctuations, a trend confirmed by on-the-ground measurements. As shown in Exhibit 10, monitored PM2.5 data for Karachi reveals a dramatic increase in pollution during the winter months (typically November through February). This is often due to meteorological factors, such as lower wind speeds and more stable atmospheric conditions including temperature inversions (where a layer of warmer air aloft traps cooler, polluted air near the ground, hindering dispersion). While Karachi’s maritime climate leads to fewer severe temperature inversions compared to inland cities, these conditions can still exacerbate pollution episodes. Reduced natural ventilation in buildings during cooler weather can also contribute.
Daily (diurnal) fluctuations: Emissions typically show distinct diurnal patterns influenced by human activity cycles:
Transportation: Peaks are commonly observed during morning and evening commute hours.
Industrial emissions: These may be more evenly distributed throughout the day but can sometimes be higher during nighttime operations, potentially influenced by factors like energy costs or specific industrial processes.
Residential contributions: While small overall for PM2.5 in Karachi, emissions from cooking are typically concentrated during morning and evening meal preparation times Coastal breeze: Karachi’s coastal location provides certain natural ventilation advantages through daily onshore (sea breeze) and offshore (land breeze) circulation, which can influence pollutant dispersion patterns throughout the day. However, these can also transport pollutants from one part of the city to another or bring in natural particles like sea salt.
A more detailed understanding of these temporal variations in Karachi would require higher-resolution activity data and continuous ambient air quality monitoring across the city.
Natural Sources and Weather
While this inventory focuses on anthropogenic emissions, it’s important to acknowledge that Karachi’s air quality is also influenced by natural particle sources, which can interact with human-generated pollution:
Sea salt aerosols: Originating from the Arabian Sea, these particles contribute to ambient particulate levels, particularly during periods of strong onshore winds.
Desert dust transport: Due to Pakistan’s predominantly arid to semi-arid climate and strong regional winds, dust can be transported from southern and western desert regions, affecting the city, especially during specific seasons or wind events.
Road dust resuspension: While linked to human activity (vehicle movement, road conditions), the resuspension of dust from paved and unpaved road surfaces, as well as from construction sites, adds significantly to particulate levels, particularly during drier periods. This is accounted for within the anthropogenic inventory but highlights the interplay between human activities and existing surface conditions.
This complex mix of anthropogenic and natural particle sources requires a nuanced management approach, focusing on controlling human-generated emissions while understanding the background influence of natural phenomena.
Pollution doesn’t blanket the city equally. Some communities breathe far more toxic air, simply because of where they live and work.
Policy Environment
Karachi’s chronic air pollution is exacerbated by deep-rooted systemic issues. Outdated technology, poor fuel quality, weak enforcement, and inadequate monitoring capacity collectively undermine efforts for cleaner air.