
Sources: Who Pollutes Karachi’s Air
This chapter details the primary anthropogenic emission sectors analyzed for Karachi’s air quality assessment. Seven major sectors were identified and quantified, encompassing a wide range of activities that contribute to the city’s pollutant load.
Transport: This sector includes exhaust emissions from on-road vehicles such as cars, motorcycles, rickshaws, buses, and trucks. It also accounts for non-road mobile sources, including emissions from railways, aviation (within the urban airshed, e.g., landing and take-off cycles), and shipping activities near port areas.
Industry: This broad category encompasses manufacturing facilities across multiple sectors prevalent in Karachi, such as textile, cement, steel, and fertilizer production, among others. It includes emissions from production processes themselves, as well as from on-site (captive) power generation used by industrial units.
Power: This sector covers emissions from grid-connected power plants and other large-scale electricity generators operating within Karachi’s airshed.
Household: Emissions from household activities are quantified here, primarily from fuel combustion for cooking and heating, though heating is less significant in Karachi’s climate.
Commercial: This sector includes emissions from commercial buildings, markets, and institutional facilities. Key sources are backup power generation (predominantly diesel generators), commercial cooking operations, and other service sector enterprises in urban centers.
Waste: This assesses contributions from the open burning of municipal solid waste and, where applicable, agricultural residues within or near the urban airshed.
Dust: While included in overall inventory calculations, dust emissions are not always shown as a separate sector in final summaries. Dust from non-exhaust particulate matter, such as road dust re-suspension from paved and unpaved surfaces are typically included within the transport sector calculations. Dust from construction and demolition activities is generally accounted for under the commercial or industrial sectors, depending on the nature of the activity. Natural dust from marine or desert environments is also a factor but treated separately from anthropogenic emissions.
Sectoral Breakdown
Karachi generates a substantial emissions load annually. For the baseline year 2021, total estimated emissions for the four primary pollutants were:
PM2.5: 39.11 kilotons
SO2: 51.52 kilotons
NOx: 100.78 kilotons
CO: 203.41 kilotons
This translates to per capita PM2.5 emissions of approximately 1.86 kg per person per year for Karachi’s population. This immense load of fine particulate matter is the direct cause of persistently hazardous air quality and health impacts.
| Sector | PM2.5 | SO2 | NOx | CO | Total |
|---|---|---|---|---|---|
| Transport | 12.77 | 20.29 | 81.11 | 183.87 | 298.04 |
| Industry | 19.10 | 13.37 | 9.55 | 6.59 | 48.61 |
| Power | 1.34 | 15.66 | 8.11 | 0.90 | 26.01 |
| Household | 0.56 | 0.04 | 1.49 | 3.67 | 5.76 |
| Waste | 2.68 | 0.04 | 0.04 | 7.68 | 10.44 |
| Commercial | 2.66 | 2.12 | 0.48 | 0.70 | 5.96 |
| Total | 39.11 | 51.52 | 100.78 | 203.41 | 394.82 |
Industrial dominance in PM2.5 Emissions: Industrial sources are the largest contributors to PM2.5 emissions, accounting for nearly half (49%) of the total. This finding directly explains the severe, year-round ambient PM2.5 concentrations that consistently exceed health guidelines, as demonstrated by the PAQI monitoring data. This underscores Karachi’s status as the country’s primary manufacturing center, hosting major facilities for steel production, petrochemicals, textiles, and cement manufacturing.
Transportation as a major contributor: The transportation sector ranks as the second-largest source of PM2.5 , contributing approximately 33%. Crucially, it dominates NOx emissions, accounting for about 80% of Karachi’s total. This is largely attributed to the city’s heavy reliance on an aging fleet of diesel vehicles, particularly those supporting extensive port and industrial logistical operations.
Significant SO2 emissions from power generation: Power generation facilities, often concentrated near industrial zones and port areas, are major contributors to sulfur dioxide emissions, responsible for approximately 30% of the total SO2 for Karachi. This primarily results from the combustion of coal and high-sulfur fuel oil in plants with limited emission control technologies.
Minimal residential contribution: Reflecting Karachi’s coastal, warmer climate and consequently reduced heating needs, residential sources contribute minimally (around 1%) to the city’s overall PM2.5 emissions.
Karachi’s Distinct Challenges
Karachi’s role as Pakistan’s primary maritime gateway presents unique pollution challenges.
Maritime emissions: Significant emissions, particularly of SO2 and particulate matter, originate from shipping vessels using heavy fuel oil within and near the urban airshed and port areas. These maritime emissions are characterized by high sulfur content and can disproportionately affect air quality in coastal zones.
Concentration of heavy diesel vehicles: The city’s port and industrial activities necessitate a large fleet of heavy diesel vehicles, including trucks, container carriers, and industrial transport vehicles. Karachi hosts Pakistan’s largest concentration of such vehicles. Despite constituting a smaller proportion of total registered vehicles, these heavy-duty diesel vehicles contribute disproportionately to transportation-related particulate emissions and NOx.
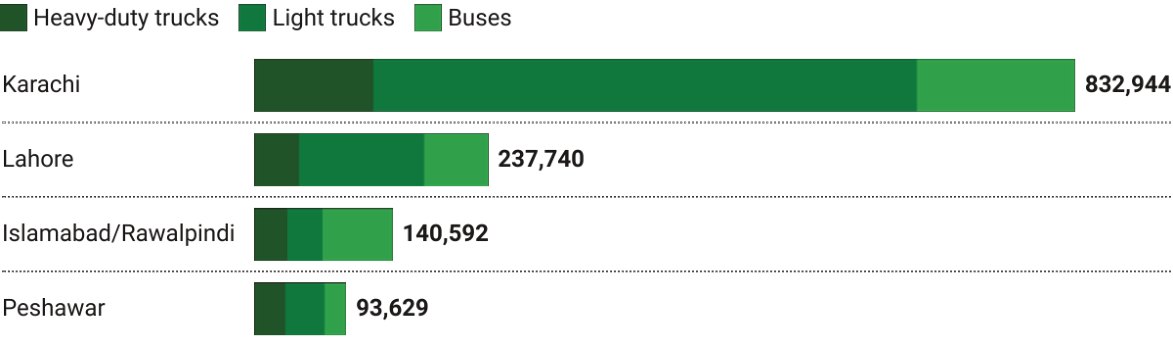
Fuel quality: The prevalence of smuggled or lower-quality fuel, particularly diesel with high sulfur content, exacerbates this problem. Official fuel consumption statistics might underestimate actual usage, and substandard fuels from informal supply chains can constitute a significant portion of the fuel used by Karachi’s truck and bus fleet. This presents a dual challenge: a high number of diesel vehicles and fuel quality issues that amplify per-vehicle emissions.
Urban service emissions (water tankers): Karachi faces a unique challenge from emissions related to essential urban services, notably water delivery. Due to inadequacies in the municipal piped water supply infrastructure, thousands of diesel-powered water tankers transport potable water daily throughout the city, creating a substantial and distinct mobile emission source.
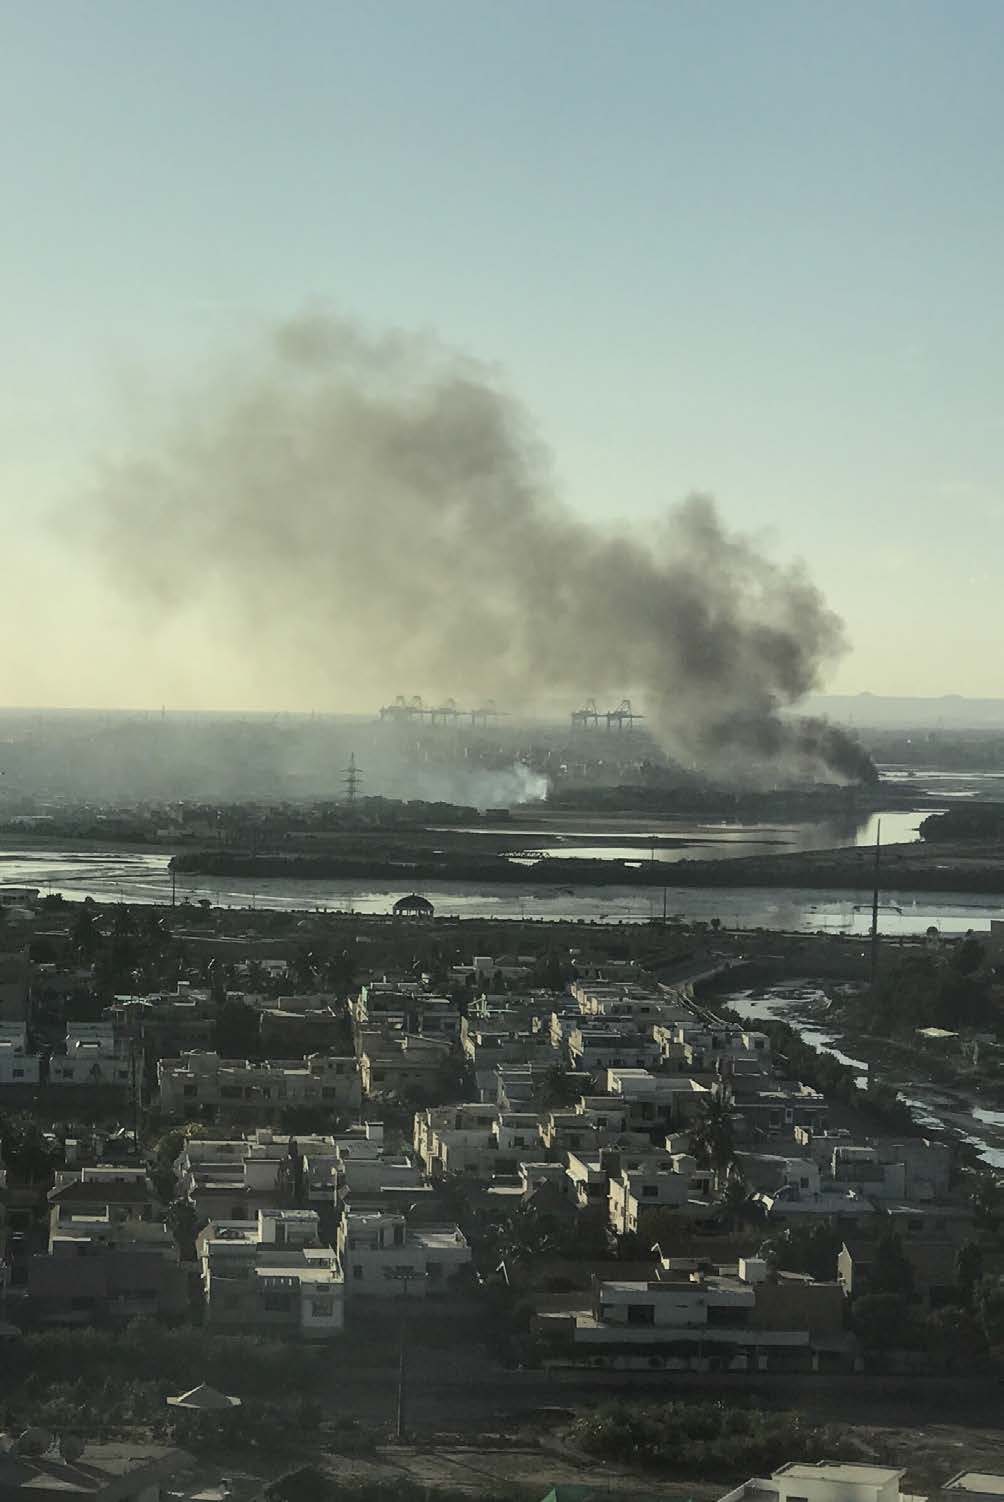
Half of Karachi’s deadly air pollution comes from industry. Add diesel trucks, dirty fuels, and ports — and the sources become undeniable.
Spatial and Temporal Hotspots
Air pollution isn’t uniform; some communities bear a much heavier burden. Emissions are concentrated in specific industrial zones, along major transport arteries, and around port areas, with pollution levels fluctuating daily and seasonally.