Open platforms for measuring and managing Pakistan’s air
Three platforms, built on ground monitoring, satellite remote sensing and official statistics, that give government, researchers and the public consistent and transparent evidence.
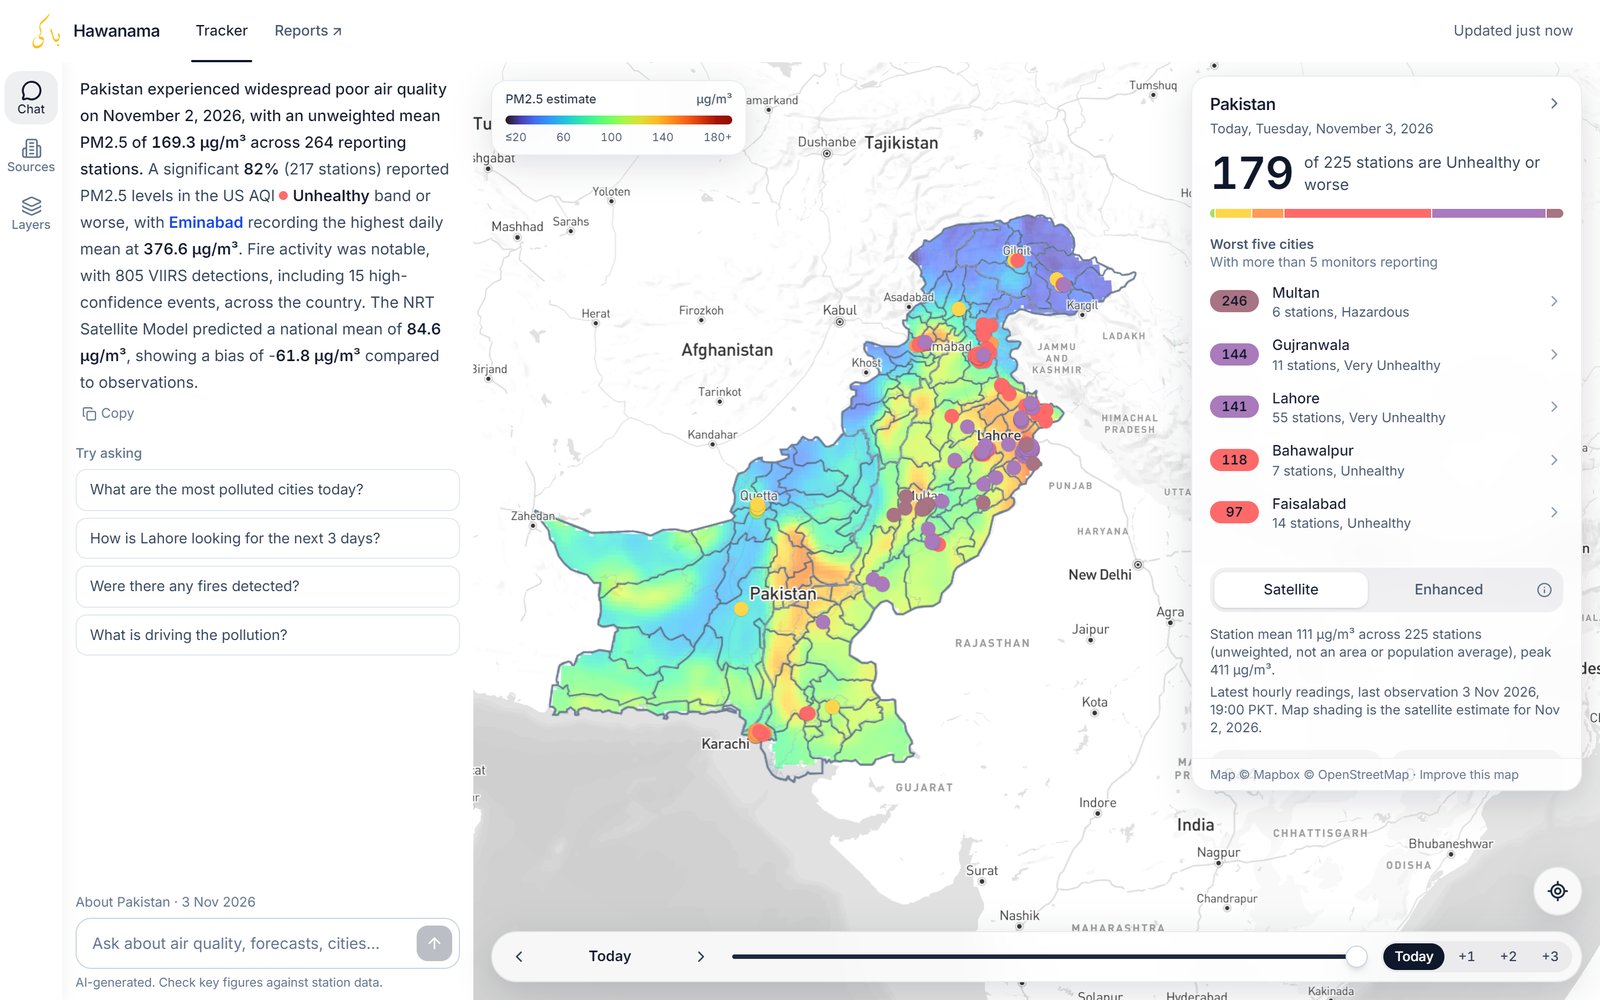
Hawanama Air Quality Intelligence Platform
Pakistan’s air quality on one live map.
Hawanama shows hourly readings from more than 200 monitoring stations over a daily satellite-based estimate of PM₂.₅ for the whole country, with forecasts for the next three days. It also maps satellite fire detections and over 11,000 brick kilns, power plants, factories and other emission sources. A built-in assistant answers questions in plain language, such as which cities are most polluted today, how Lahore looks for the next three days, or what is driving the pollution.
- Tracker: hourly station readings over a daily PM₂.₅ estimate for all of Pakistan
- Three-day forecasts and the most polluted cities at a glance
- Ask Hawanama: answers on pollution levels, forecasts, fires and their causes
- Emission sources: 10,585 brick kilns, plus power plants, cement, steel and sugar mills and other industry
- Map layers for satellite fire detections (NASA FIRMS VIIRS), wind and population
PAQI Reports
Air quality reports for Pakistan’s cities, ready to share.
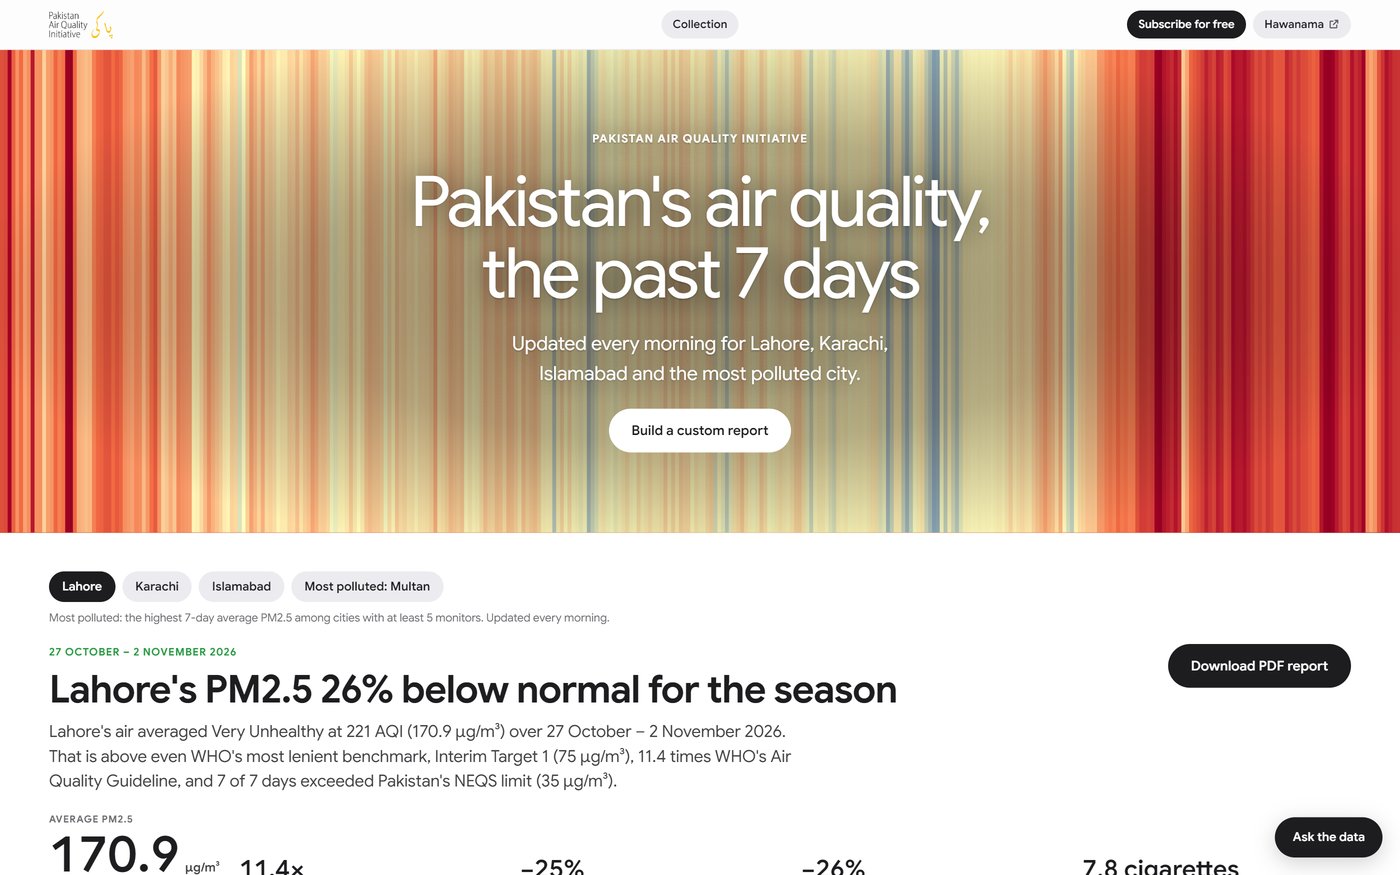
PAQI Reports turns Hawanama monitoring data into plain-language reports. A summary of the past seven days for Lahore, Karachi, Islamabad and the most polluted city is updated every morning. Custom reports cover any dates since 2018 for up to four cities, with findings, charts and a PDF to share.
- The past 7 days: updated every morning for four cities
- Custom reports: any dates since 2018, up to four cities, with a downloadable PDF
- Weekly brief by email every Monday, with PAQI’s forecast
- Ask the data: questions about any Pakistani city and dates since 2018
Pakistan Emissions Explorer
Pakistan’s greenhouse-gas emissions, traceable to source.
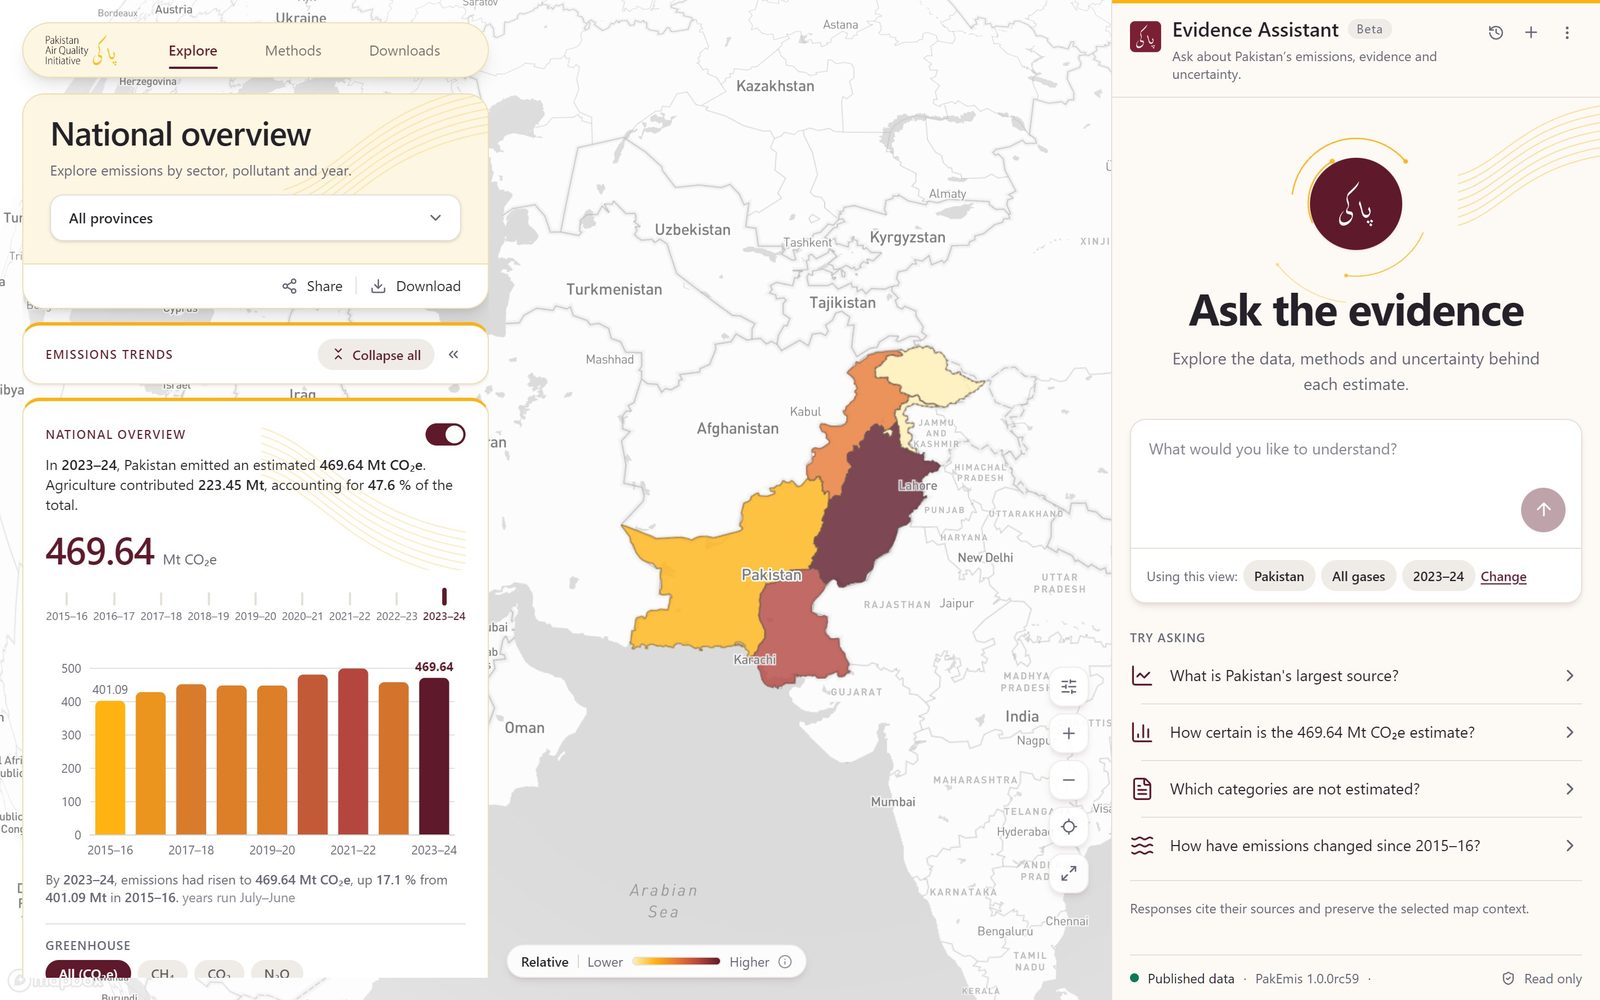
The Emissions Explorer reconstructs Pakistan’s greenhouse-gas emissions from public documents for each fiscal year from 2015–16 to 2023–24. Estimates can be viewed by province, sector and gas, and every figure links back to its source. An evidence assistant answers questions about the data, methods and uncertainty.
- National total of 469.64 Mt CO₂e in 2023–24, up 17.1% from 2015–16
- Provincial and sectoral breakdowns; agriculture accounts for 47.6%
- CO₂, CH₄ and N₂O, with air pollutants (NOₓ, SO₂, CO, PM₂.₅, black carbon) in beta
- Published methods and downloadable datasets
- Evidence assistant with cited responses
Monitor Network Design
Where new monitors deliver the greatest public benefit.
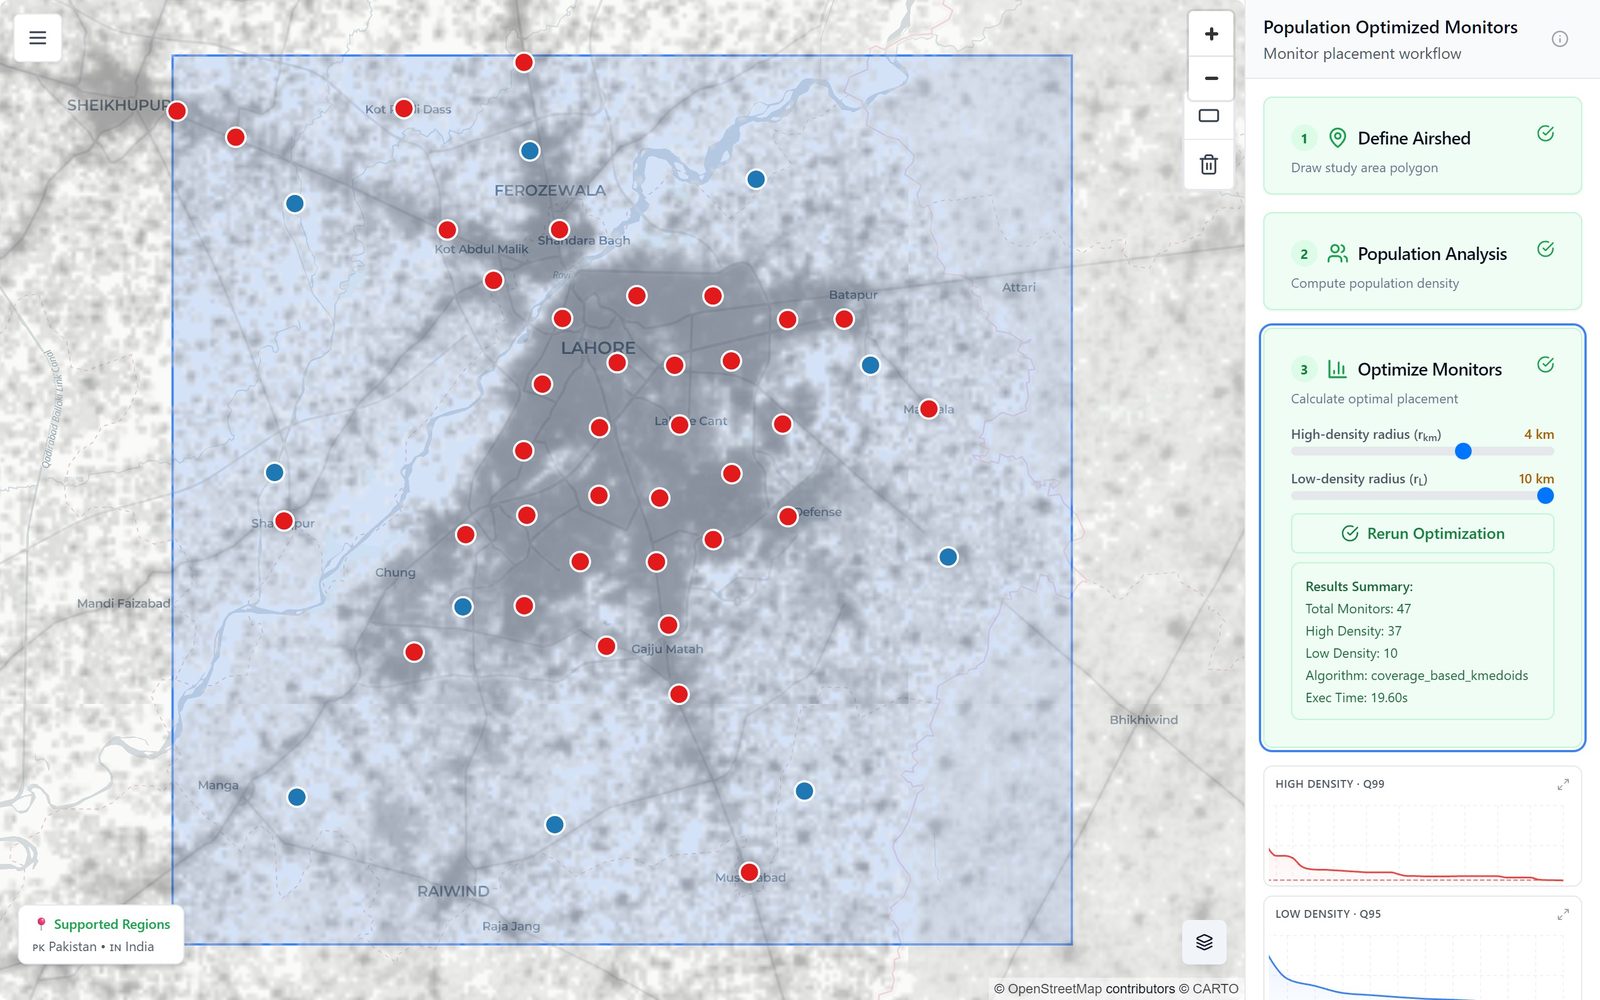
A spatial optimisation tool that recommends monitor locations to maximise population coverage for a given budget. Users define an airshed, analyse population density and generate optimised placements. Precomputed runs are available for nine major Pakistani cities.
- Population-weighted coverage scoring
- Gap analysis against existing monitors
- Precomputed runs: Faisalabad, Gujranwala, Hyderabad, Islamabad/Rawalpindi, Karachi, Lahore, Multan, Peshawar, Sialkot
A consistent, transparent
evidence chain
Collect
Ground monitoring, satellite remote sensing, meteorological reanalysis and official statistics are compiled into a single quality-assured pipeline.
Model
Statistical and machine-learning models produce estimates where direct measurement is unavailable. Models are validated against independent observations, and uncertainty is reported alongside results.
Publish
Data are released openly under a CC BY 4.0 licence with documented methods. We work with government, researchers and the media so that findings inform decisions.
Partner with us
We work with federal and provincial agencies, development partners, research institutions and the media on data access, technical assistance, custom analysis and capacity building.