The interactive map needs WebGL, which is turned off or unavailable in this browser.
Enable hardware acceleration, or open the site in another browser.
Pakistan Air Quality Initiative
Evidence for cleaner air in Pakistan
An independent research organisation providing open data, scientific analysis and technical support for air quality management in Pakistan since 2016.
Air pollution is among the leading environmental risks to health in Pakistan.
Most of the population lives without routine air quality measurement, and decisions are too often made without timely, credible data.
Open data, rigorous research, practical policy support
Data
We compile, quality-assure and publish open air quality and emissions data, combining ground monitoring, satellite remote sensing and official statistics into a consistent national record.
Research
We produce peer-reviewed analysis of pollution sources, exposure and health impacts, with transparent methods and stated uncertainty, so that findings can be reproduced and built upon.
Policy engagement
We provide technical support to federal and provincial institutions, contribute to national policy processes and inform public understanding through the media and civil society.
Latest from PAQI
Reports, analysis, publications, news and events.

Multan averaged 18 times WHO's daily guideline while Karachi had the cleanest air
Karachi's PM2.5 fell 23% to 38 µg/m³, still 2.5 times WHO's daily guideline.

Fire activity, crop-residue burning and transboundary air pollution in Punjab
Lahore averaged 175 µg/m³ of PM2.5 on days its air had passed over active burning, against 93 µg/m³ on other days.

Multan averaged 16 times WHO's daily guideline as PM2.5 rose in 3 of 4 cities
Lahore's PM2.5 rose 47% to 214 µg/m³, and even Karachi, the cleanest city, averaged 3 times WHO's daily guideline.

PM2.5 rose in all 4 cities and Multan averaged 12 times WHO's daily guideline
Karachi's PM2.5 rose 74% to 72 µg/m³, and even Islamabad, the cleanest city, averaged 4 times WHO's daily guideline.
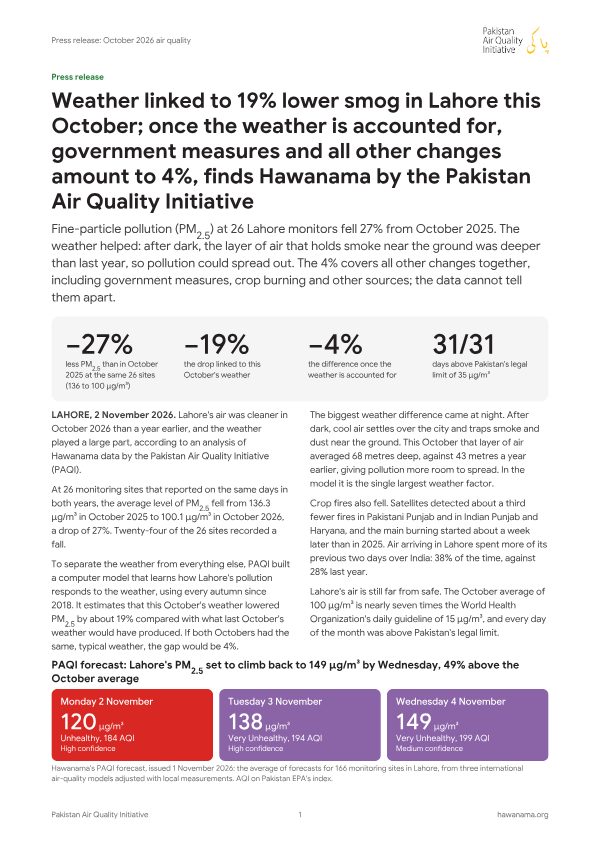
October 2026 Air Quality Analysis
PAQI's analysis for October 2026. Lahore showed an improvement from previous years. But how much of that is attributed to government's policies?
District-Level Road Transport Emission Inventory for Punjab, Pakistan: A 2015–2023 Multi-Year Assessment
A district-level inventory of six road-transport pollutants across Punjab's 36 districts and nine vehicle classes, built from PBS registration data with Weibull vehicle-survival and emission-factor corrections.
Air Sensors International Conference 2026
PAQI gave a presentation and presented a poster at the 2026 Air Sensors International Conference, organised by the UC Davis Air Quality Research Center.

EGU General Assembly 2026
PAQI presented a poster at the European Geosciences Union General Assembly on air quality and emissions in Pakistan.
-

-

-

-
 Daily Times
-

-

-
 Arab News
-
 ThePrint
-
-

-
 The Independent
-

-

-
 WWF Pakistan
-
 CNA
-
 Malay Mail
-
 India Today
- Pakistonomy by Uzair Younus
A year of Pakistan’s air
Each stripe is one day of PM₂.₅ in 2025. White marks 35 µg/m³; blue days were cleaner, while red and black days were smog.
Data: PAQI monitoring network, the mean of all monitors in each city (PAQI, Urban Unit, Punjab EPA and other networks); 24-hour average PM₂.₅.
Open data platforms
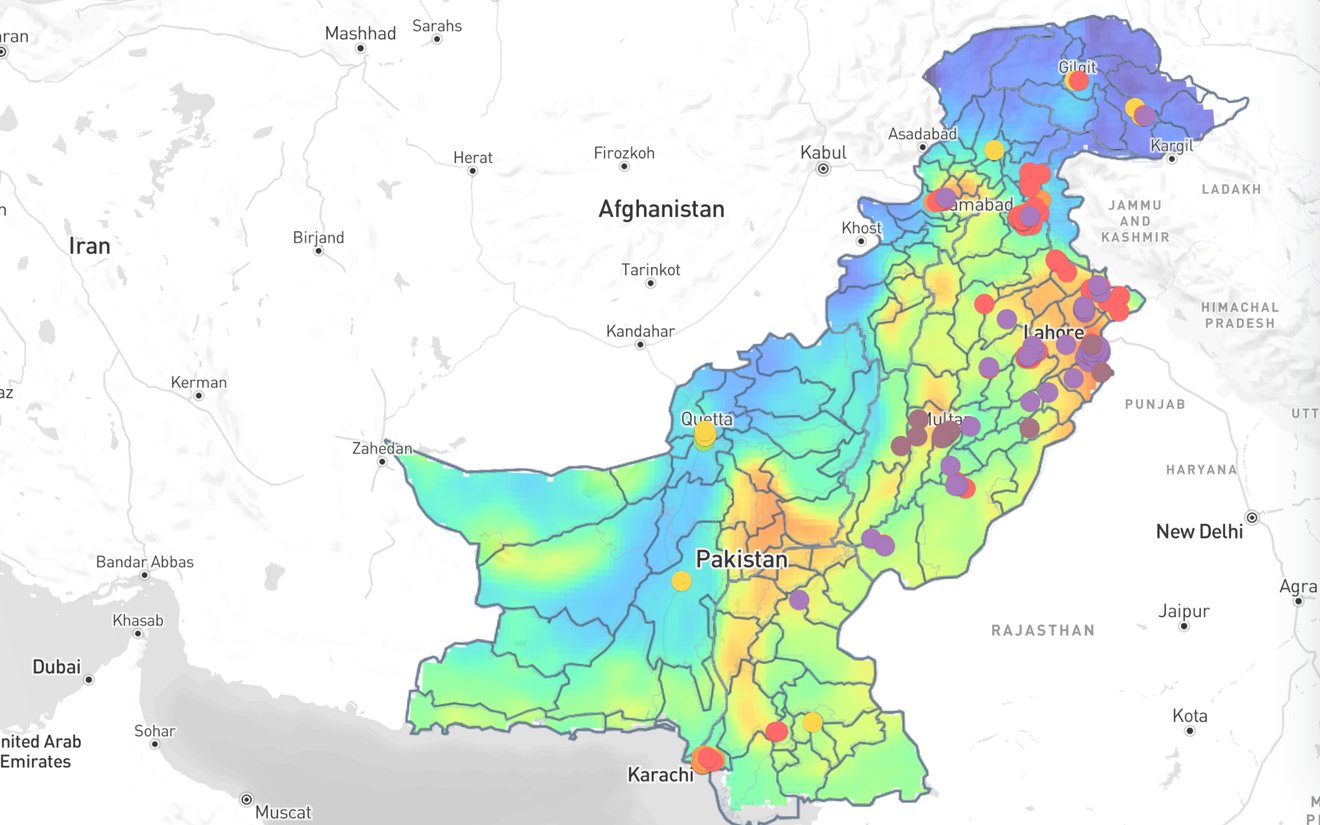
Hawanama
A live map of Pakistan’s air: hourly station readings, daily satellite PM₂.₅ estimates, three-day forecasts and an assistant that answers your questions.
hawanama.org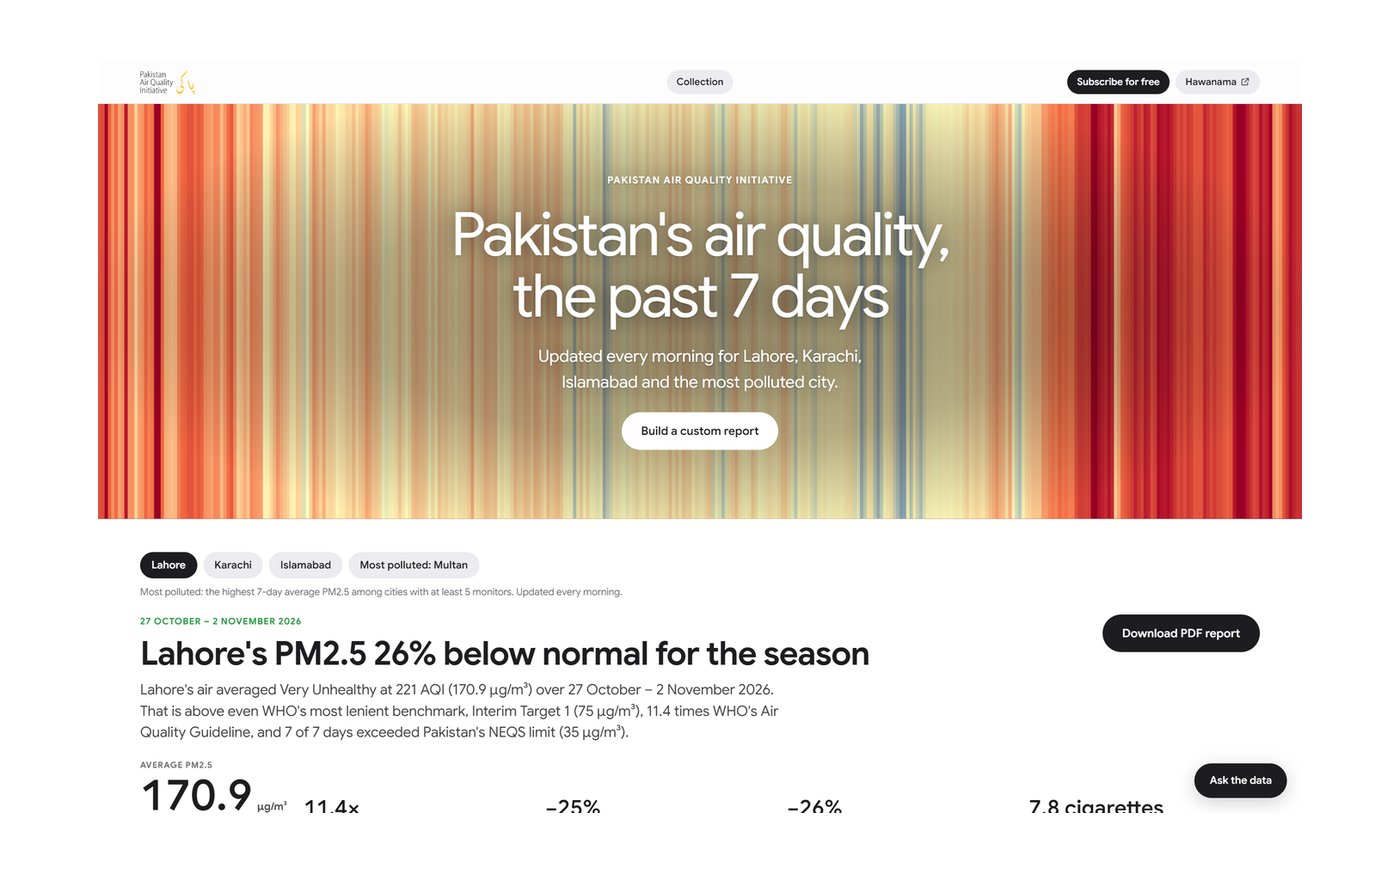
PAQI Reports
City air quality reports updated every morning, custom reports for any dates since 2018, and a weekly brief by email.
reports.hawanama.org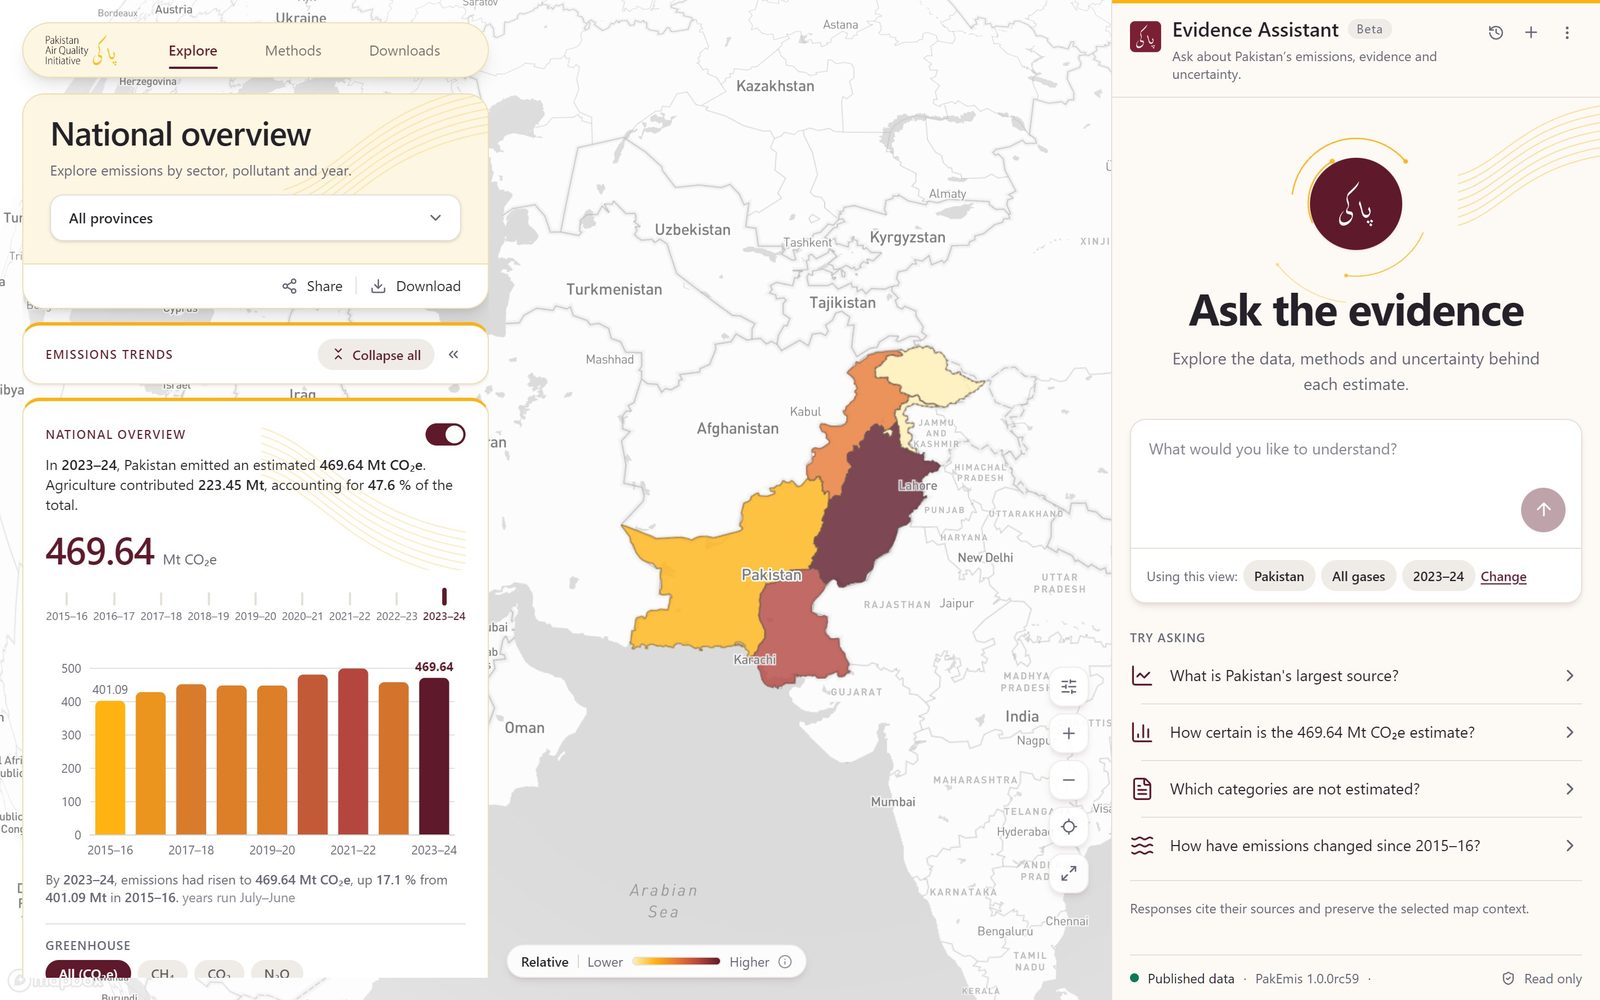
Pakistan Emissions Explorer
National and provincial greenhouse-gas emissions, 2015–16 to 2023–24, traceable to source documents.
emissions.hawanama.org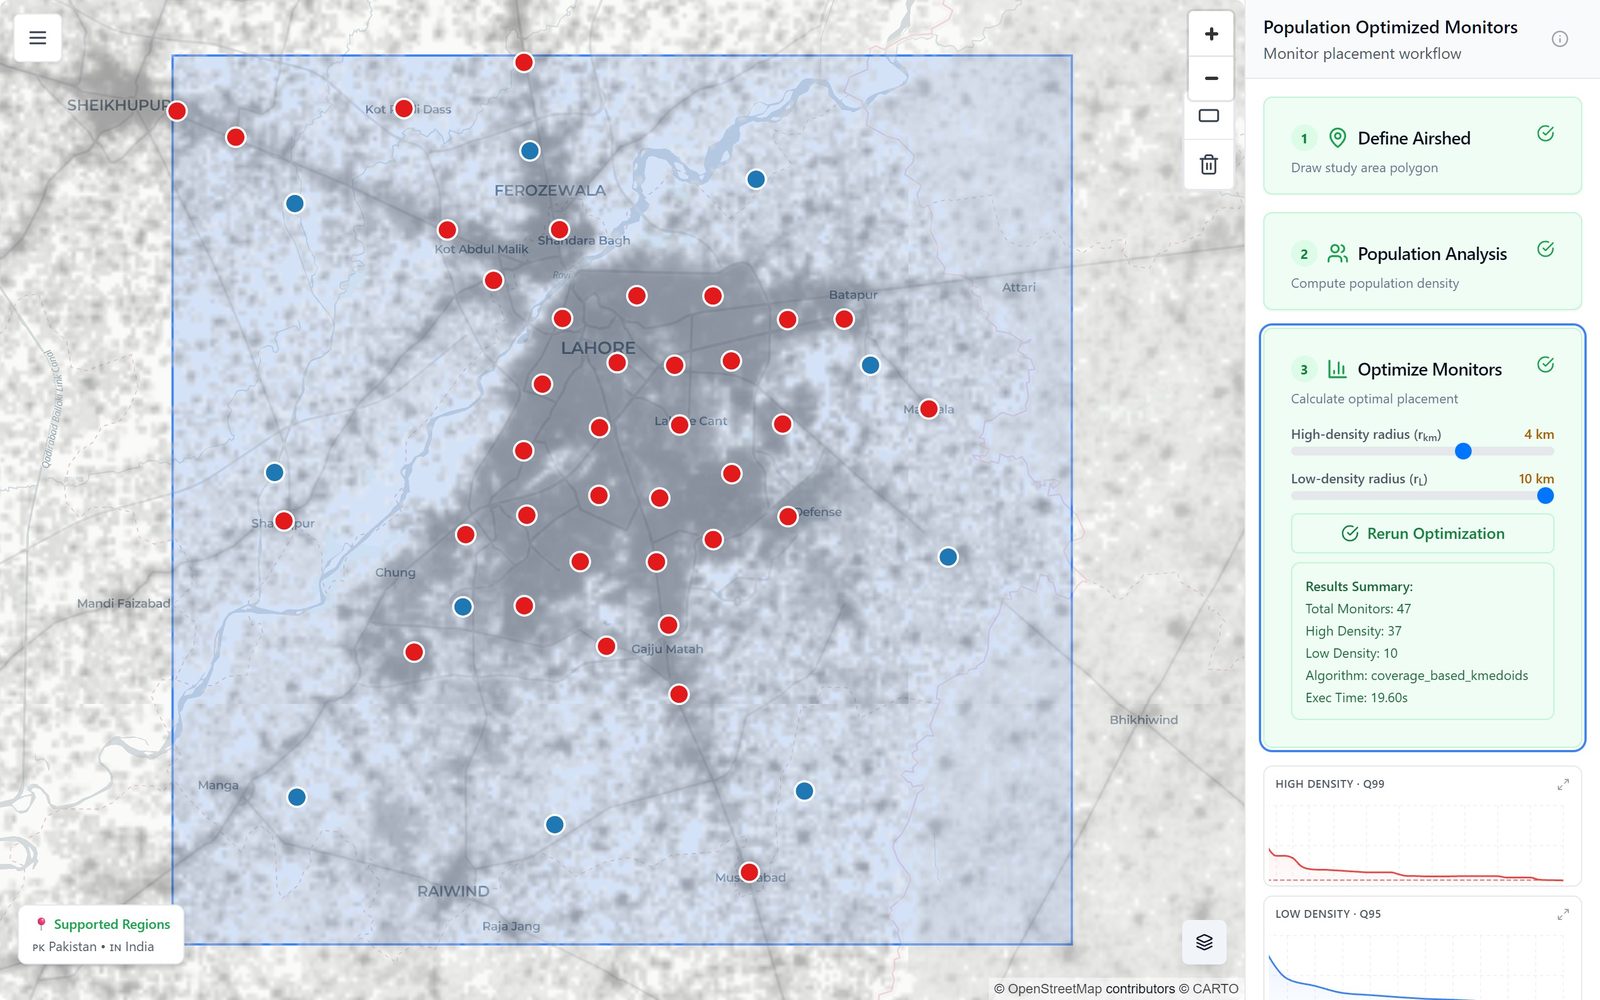
Monitor Network Design
Population-weighted siting of new monitors for nine major cities.
population-optimized-monitors.web.app