
Methodology: How we Measured Karachi’s Air
Key Methodological Pillars:
- Emissions are calculated based on actual activity levels (e.g., fuel use, industrial output) and specific emission factors for the baseline year 2021.
- Key pollutants (PM2.5, SO2, NOx, CO) are inventoried due to their severe health and environmental impacts.
- A hybrid Tier 1/Tier 2 approach ensures the highest accuracy with available regional and local data.
Which Pollutants Matter Most?
The analysis focused on four criteria air pollutants that are widely recognized for their significant impact on urban air quality and public health:
Particulate Matter (PM2.5): Fine inhalable particles with aerodynamic diameters generally 2.5 micrometers and smaller. These particles can penetrate deep into the respiratory system and enter the bloodstream, leading to cardiovascular and respiratory diseases and other health complications.
Sulfur Dioxide (SO2): A colorless gas with a pungent odor, primarily produced from the combustion of fossil fuels (such as coal and oil) containing sulfur, commonly found in power plants and industrial processes. It can cause respiratory problems and contributes to the formation of acid rain and secondary particulate matter.
Nitrogen Oxides (NOx): A group of highly reactive gases, primarily nitric oxide (NO) and nitrogen dioxide (NO2), formed during high-temperature combustion processes. Major sources include vehicle exhausts, power plants, and industrial boilers. NOx contributes to the formation of smog, acid rain, and secondary particulate matter.
Carbon Monoxide (CO): A colorless, odorless, and toxic gas produced by the incomplete combustion of carbon-containing fuels. Vehicle exhaust is a major urban source. CO reduces the oxygen-carrying capacity of blood.
Data Sources and Tiers
International best practices, such as those outlined by the Intergovernmental Panel on Climate Change (IPCC) for greenhouse gases and the EMEP/EEA Air Pollutant Emission Inventory Guidebook, categorize methodologies into tiers based on sophistication and data requirements.
Tier 1 methods employ readily available, often default or globally averaged EFs, combined with relatively aggregated AD.
Tier 2 methods utilize country-specific or region-specific EFs, often differentiated by major technology types, along with more detailed and disaggregated AD.
Tier 3 methods represent the most sophisticated approach, employing detailed process models, facility-specific data, and EFs that account for specific technologies and local operating conditions.
This inventory for Karachi predominantly used a Tier 1/Tier 2 hybrid approach. The selection of this approach was guided by the availability of local and regional data, aiming for the highest possible tier achievable across different sectors. The reliance on regional EFs from resources like the Urban Emissions database aligns with Tier 2 for many applications, while the use of EMEP/EEA default factors for some under-researched sectors aligns with Tier 1.
Mapping the Hotspots
To visualize the geographical distribution of emissions across Karachi, sectoral emission totals were allocated onto a 1 km x 1 km grid covering the city’s airshed. This process, essential for identifying potential pollution hotspots and informing spatially targeted interventions, relied on various proxies due to limitations in precise source location data for all emitters:
Population density: Used as a proxy for distributing emissions from residential activities and open waste burning.
Road networks: Utilized for allocating transport emissions, often weighted by road type or capacity where such data were available.
Known coordinates: Employed for major point sources such as large industries, power plants, ports, and airports, where specific location data could be ascertained.
Settlement density: Used for allocating emissions related to construction activities and dust in the absence of specific project data.
While this spatial allocation provides valuable insights into emission patterns, it is acknowledged that the use of proxies introduces a degree of uncertainty. Future refinements would benefit from more sophisticated spatial surrogates, such as detailed land-use maps, traffic flow data, and comprehensive industrial site databases.
Limitations of this Study
The development of this emissions inventory encountered several limitations that contribute to uncertainty in the final estimates. These include:
Data gaps: Incomplete or outdated activity statistics, particularly for informal sector activities and small-scale industries, which constitute a substantial portion of urban economic activity in Karachi.
Emission factor uncertainties: The limited availability of Pakistan-specific, locally measured emission factors for all source types necessitated the use of regional or international default values in some instances.
Spatial allocation challenges: Imprecise location information for numerous small and diffuse sources required the use of proxy indicators for spatial mapping.
Temporal representation: While this inventory represents annual emissions for the baseline year 2021, it does not fully capture finer seasonal or diurnal variations without more detailed temporal resolution in activity data.
Despite these limitations, this emissions inventory provides the most comprehensive assessment of urban emissions currently available for Karachi. Based on the methodology described (Tier 1/2 approach, reliance on regional EFs, acknowledged data gaps, and preliminary spatial allocation), the overall confidence in this initial inventory is assessed as Moderate. Findings for sectors with better official data (e.g., power plants, registered fuel sales for transport) likely have higher confidence than those relying more heavily on assumptions or less formal data (e.g., waste burning, informal industry, construction dust). This inventory establishes a crucial foundation for improved air quality management planning and a benchmark for future, more refined studies.
How Emissions Are Calculated
The estimation of anthropogenic air pollutant emissions in Karachi for this inventory is based on the internationally recognized methodology, centered on the standard emissions calculation formula:
Where: *Ep,s = Total emissions of a specific pollutant (p) from a source category (s), typically in tons per year. *ADs = Activity Data for the source category (s), representing the magnitude of the activity (e.g., tons of coal burned, vehicle-kilometers traveled). *EFp,s,t = Emission Factor for the pollutant (p), specific to the source (s) and the control technology (t) used (e.g., grams of PM₂.₅ emitted per ton of coal burned).
Activity Data (AD): This quantitative measure reflects the level or intensity of human activity that leads to emissions. Examples pertinent to this inventory include fuel consumption by various vehicle types, volume of industrial production from different manufacturing sectors, energy generated by power plants, and quantities of waste burned. The data for this inventory were primarily compiled for the baseline year 2021, selected as the most recent year with relatively complete datasets across key sectors at the time of analysis. Challenges such as delays in official data publication and potential revisions to historical data are acknowledged as factors impacting inventory timeliness and stability.
Emission Factor (EF): This coefficient represents the average mass of a specific pollutant emitted per unit of activity. The EF is specific to the emission source, the technology employed, fuel characteristics, and prevailing operating conditions. For instance, an EF for vehicular emissions might be expressed as grams of PM2.5 emitted per vehicle-kilometer-traveled (VKT) for a specific vehicle type using a particular fuel.
The selection of appropriate EFs is critical for accuracy. This study prioritized EFs reflecting regional relevance and technology considerations, primarily sourcing from the Urban Emissions database, which is recognized for its applicability to South Asian conditions. For sectors where specific regional data were deficient, such as certain non-road mobile machinery and maritime shipping, default Tier 1 EFs from the EMEP/EEA Guidebook (2019 edition) were utilized. A key area for future improvement is the development and validation of Pakistan-specific EFs through local measurement campaigns.
Ep,s = ADs × EFp,s,t
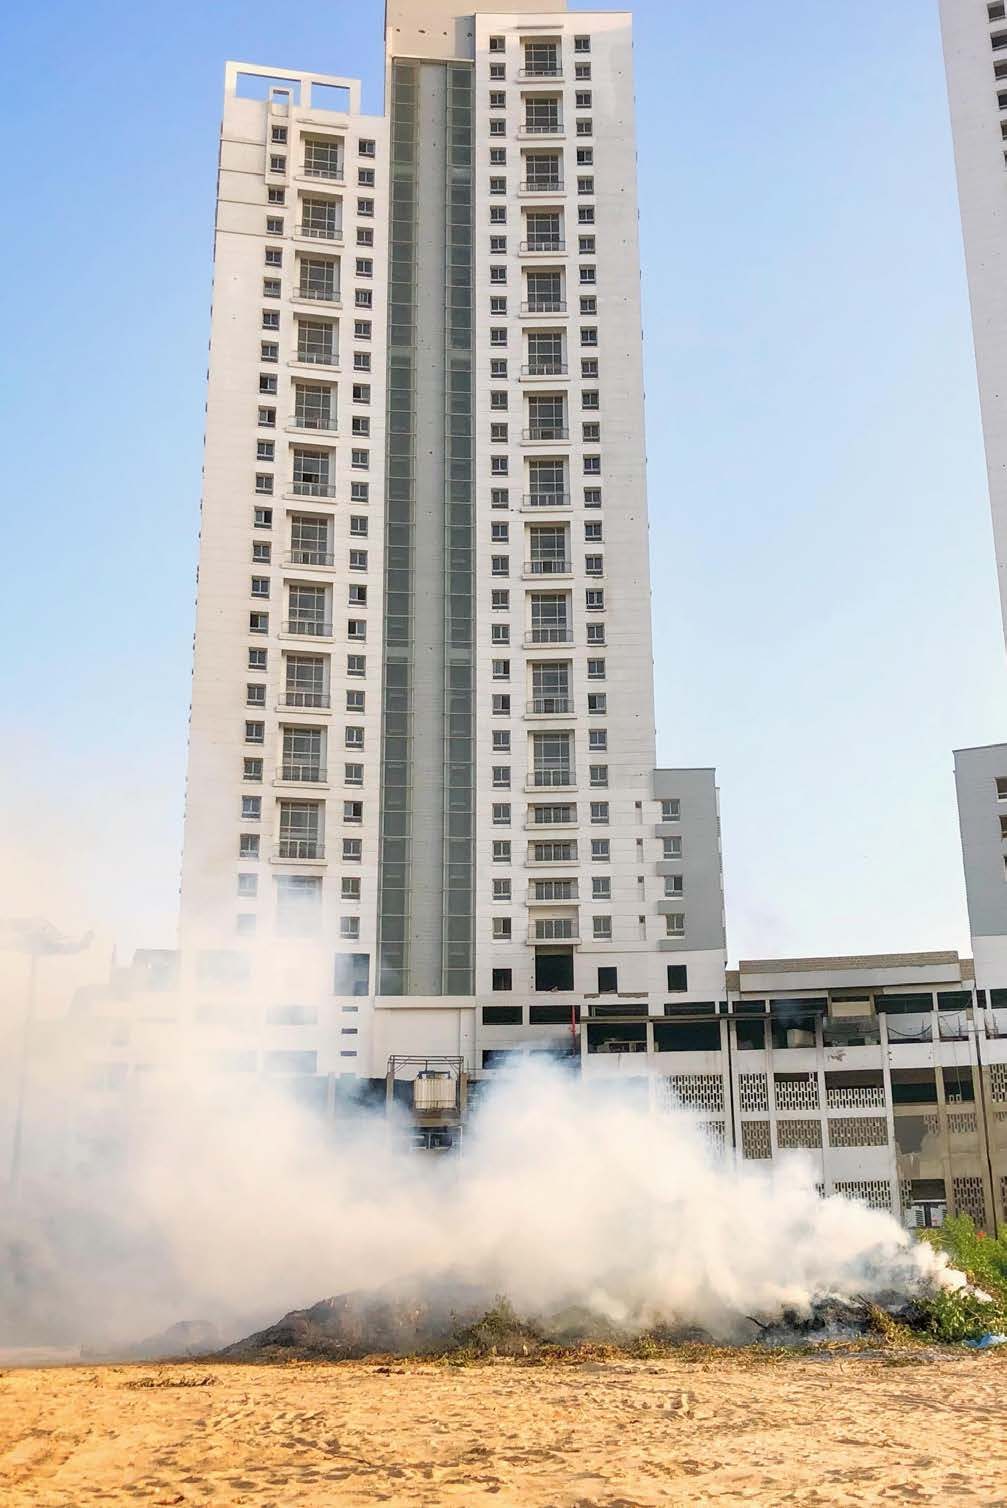
This is Karachi’s first science-based emissions inventory, built with global methods, local data, and a clear aim: to uncover the invisible crisis we all breathe.
Analysis
Pinpointing the primary sources of pollution is the first step towards cleaning Karachi’s air. Industrial operations, heavy transport, and power plants are the dominant contributors to the city’s hazardous emissions.